Watching vLLM Think: Why to monitor with Grafana
I've been generating a lot of synthetic data non-stop. Since I bought the RTX Pro 6000 Blackwell 96GB its been running around the clock without rest - generating said synthetic data. Millions upon millions of workload items move through vLLM for days on end. Earlier into this I treated vLLM like a black box. Start the workload, watch it progress. Wonder what the metrics were that vLLM emitted via stdout. There were times though where processing was taking ages and I had to dig in to figure out why. That's when I started optimizing things and realizing this is an art. The art of optimizing inference workloads. This is a personal project using personal time and personal resources.
Since, I've put Prometheus and Grafana into my stack, alongside vLLM. vLLM exposes a /metrics endpoint with everything needed for monitoring. Prometheus scrapes that endpoint, and Grafana uses Prometheus as a datasource to power dashboards to visualize the performance. These both live as code in my "from scratch LLM" private repository. Though I may open source the monitoring pieces - more to come on that. Anyway, the dashboard in Grafana is a JSON file that Grafana provisions upon startup. I'm using docker compose /w a restart policy set to unless-stopped, so a simple docker compose up -d makes sure everything just stays running in the monitoring stack. If I ever needed to wipe and rebuild my tower, everything is trivially stood back up from my private repo.
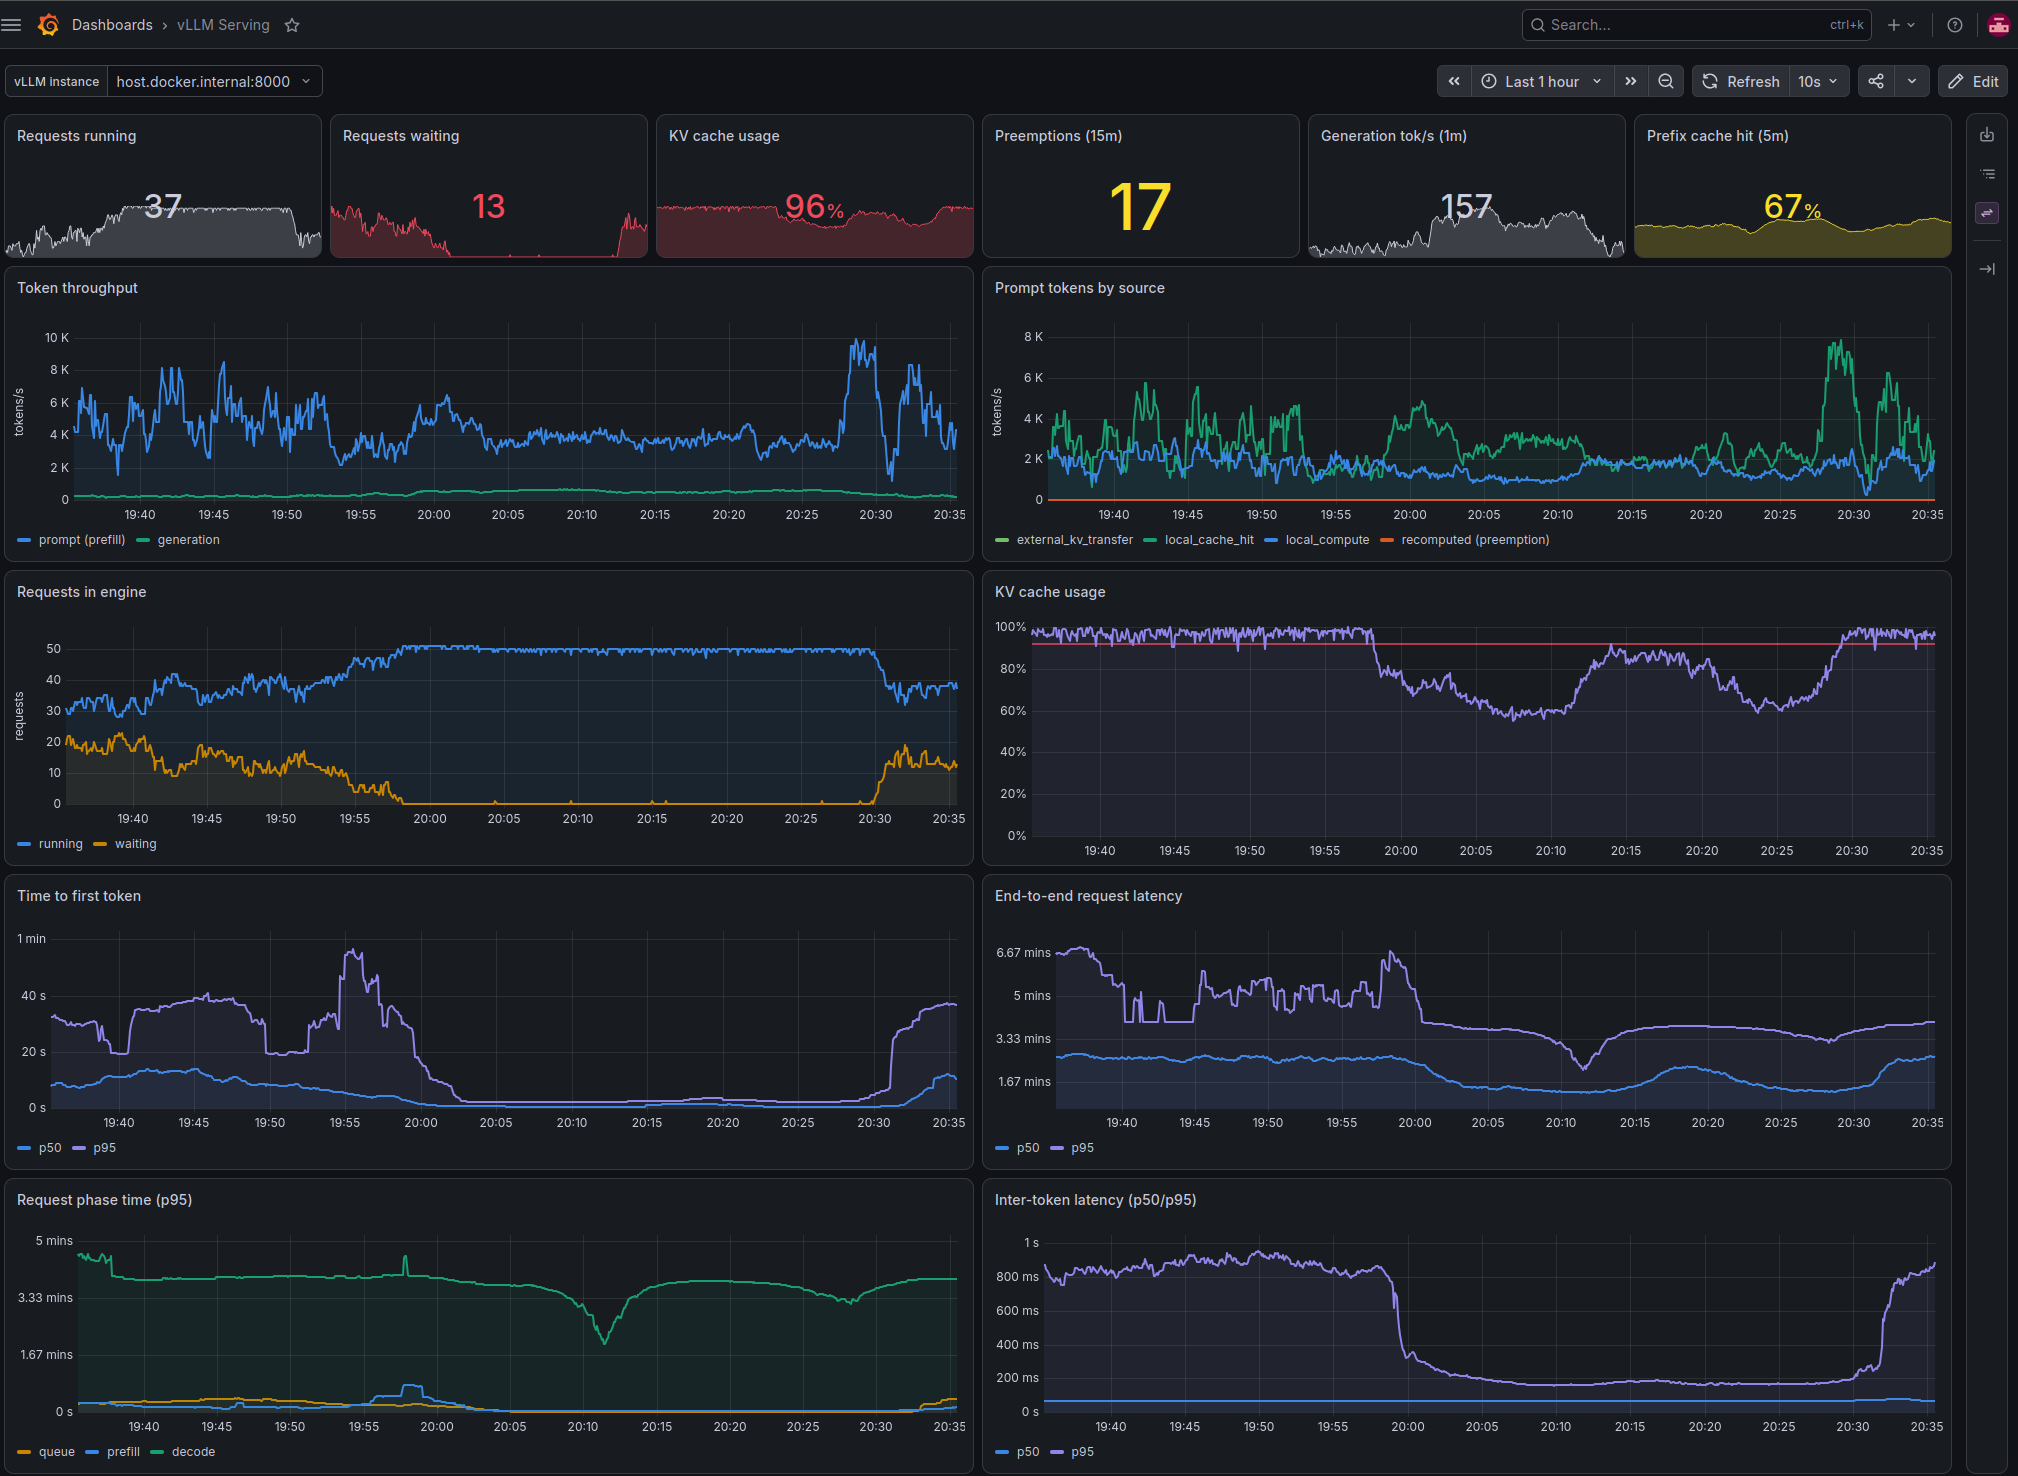
The KV Cache use - this one lies if you read it wrong. A full cache can look scary but actually it's vLLM doing what it's supposed to do. The issue is what happens near total saturation - the details matter. The prefix cache shares the same memory pool and when active requests fill the prefix cache, vLLM boots cached prompt prefixes to make space. When that happens, you pay for the prefill again, and again. Because it's not cached. That hurts the tokens per second, the time to first token, everything.
The prefix cache hit rate - this metric is what catches the cache kick problem that the KV cache use metric can hide. My workloads send a lot of items that share a pretty substantial common prefix. It's normally a big source article and a big set of instructions and a system prompt - all the same identically four multi-thousands of inference requests. When the prefix hit rate is high, this is good - you're paying for the prefill once and reusing it many times from cache. When your hit rate is zero or very low, you're paying that tax every request - it makes everything super slow and that's not what you want. Speed is the #2 name of this game with generating synthetic data. (#1 is shapes balance, #3 is quality, more on that in the future).
Latency panels - I have severla panels that simply track latency of various things. Time to first token is one, it tells you how long a request waits until the first response token is generated. This is basically measuring the prefill rate and queue time. Inter-token latency is how long between between each generated token - this tells you if there's decode contention. Together these things tell you if you've got too many requests in flight or too little. Preemptions are the alarm siren, any climb in preemptions means the requests are being evicted and then recomputed - meaning you're paying basically twice for one work item (which is awful).
Now with these dashboards in Grafana, I can tune my workload size and see the effects live, visually. Is it better than before, is it worse than before? The instrumentation is easy to read, we aren't LLMs that thrive on text, we are a visual species and the graphs give us enormous analytical understanding. Too few workers and I see my decode is too thin. Too many and I see the KV cache usage creaping up and then prefix hits take a nose dive. Tokens per second is the most important overall, you want to maximize this ultimately but you don't know if it's at its peak without all these other metrics.
None of this is all that unique, it's standard. It's two docker containers and a compose file. If you're running vLLM and days matter (and if months matter too), you want a dashboard and you want to be actively optimizing your workload based on the metrics you're seeing.